
Event revenue
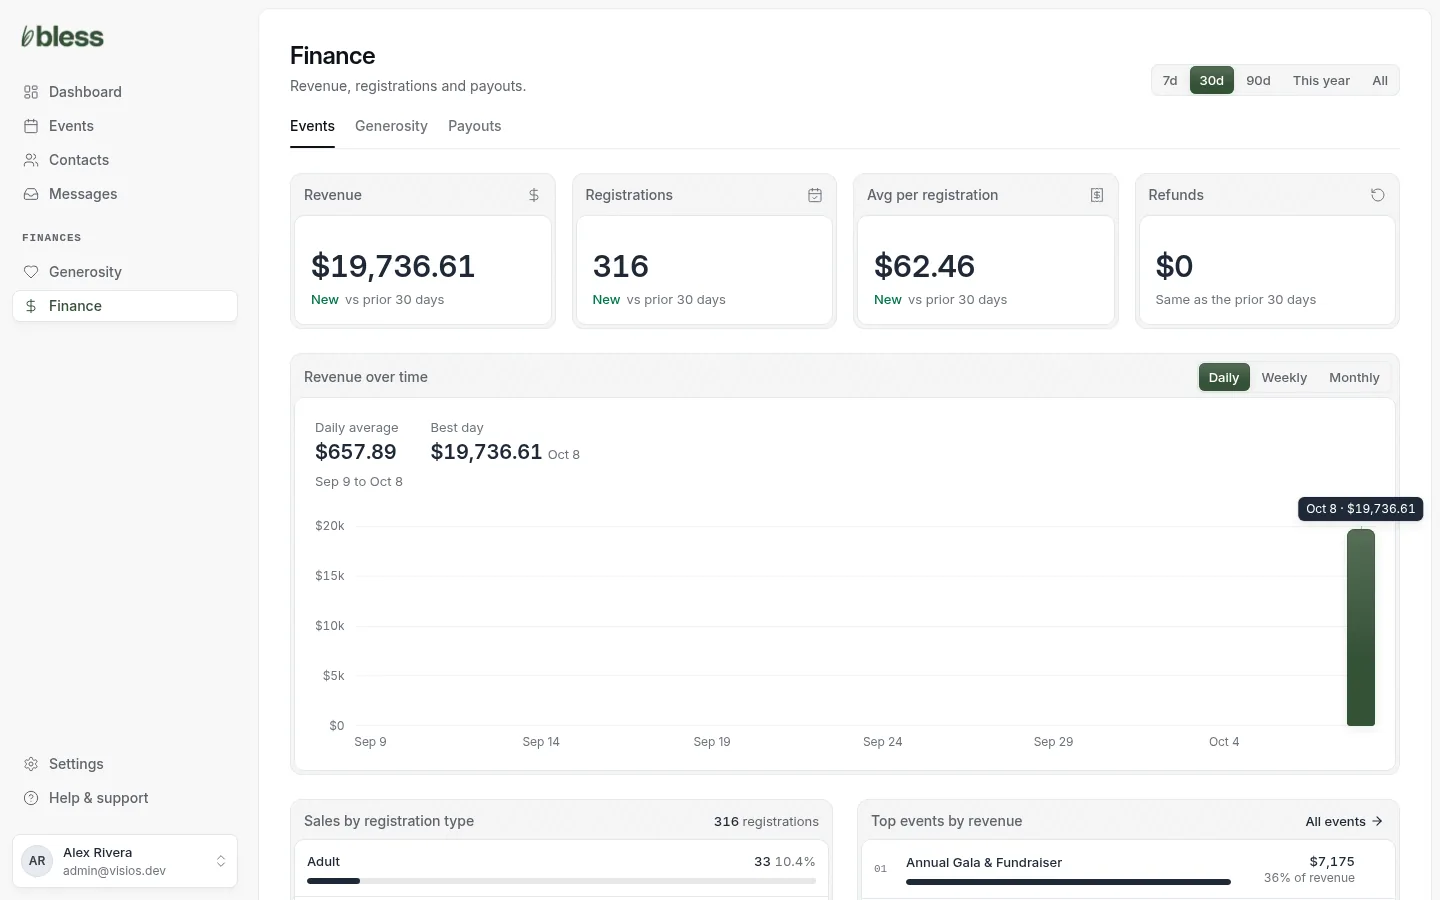
The Events tab shows what your events brought in for a period, what sold, which events earned most, and the latest payments.
Open the Events tab
Press Finance in the sidebar. The Events tab opens. You can also press Event revenue on the Dashboard.
Choose the period
Press a period at the top right: 7d, 30d, 90d, This year or All. The page shows 30d first.
Every number on the page uses the period. The cards compare it with the period just before, such as “vs prior 30 days”.
The four numbers
| Card | Shows |
|---|---|
| Revenue | What people paid for registrations and add-ons, before fees. A refunded payment still counts at its full amount. |
| Registrations | How many registrations people bought. |
| Avg per registration | Revenue divided by registrations. |
| Refunds | Payments refunded in full, for payments made in the period. A part refund does not count here. |
The New label means there was nothing to compare in the period before.
Revenue over time
The chart shows revenue for each day, week or month. Press Daily, Weekly or Monthly. Point at a bar to see its amount. Above the chart, you see the average and the best day.
What sold
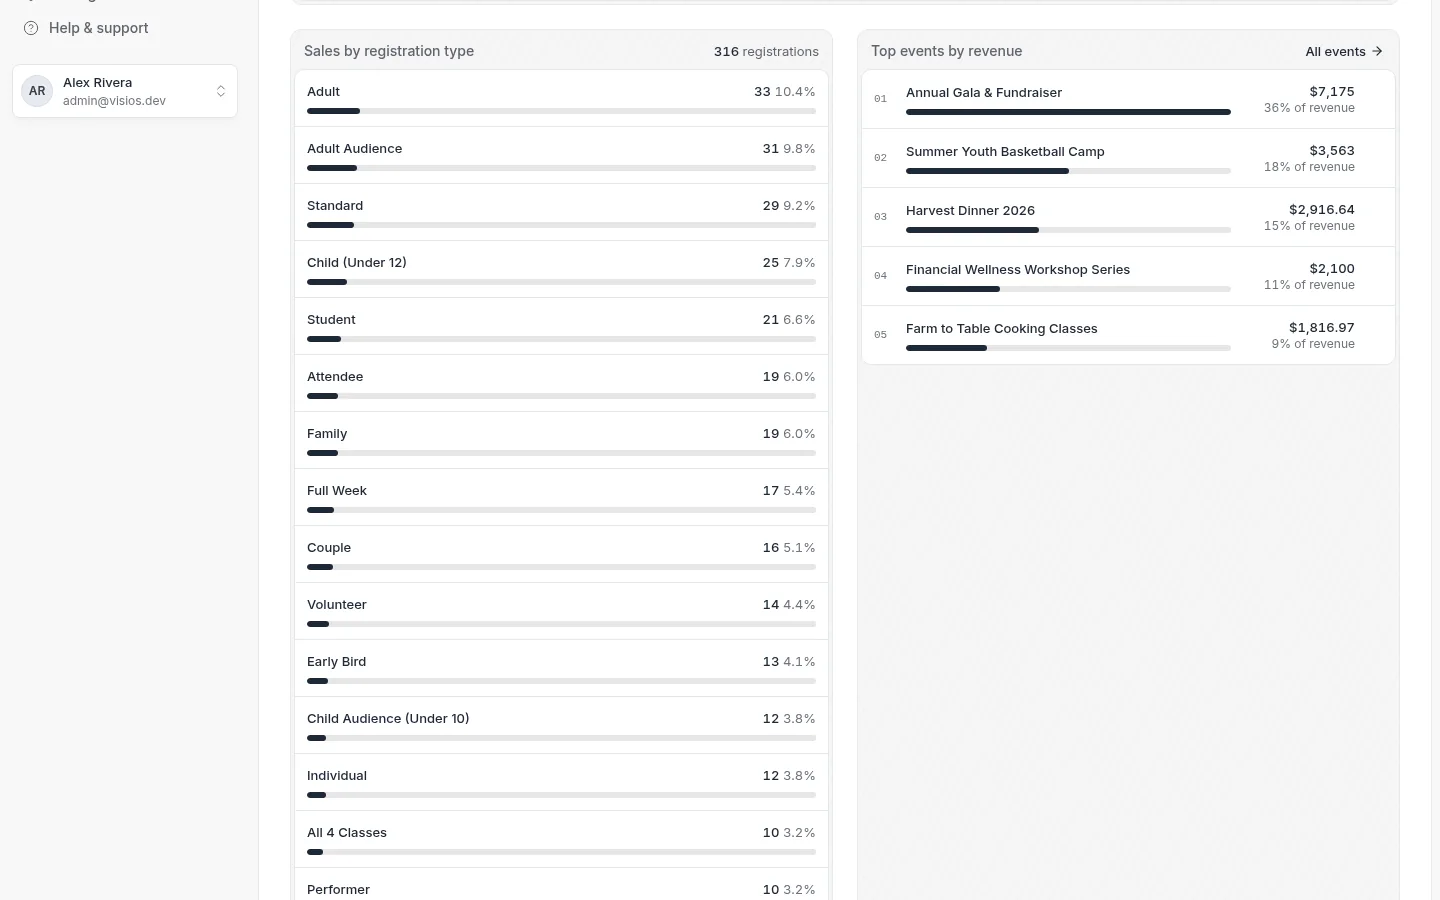
- Sales by registration type shows how many of each type sold, and its part of the total. Add-ons follow, marked Product.
- Top events by revenue shows the five events that earned most, and each one’s part of the revenue. Press an event to open it, or press All events.
Recent transactions
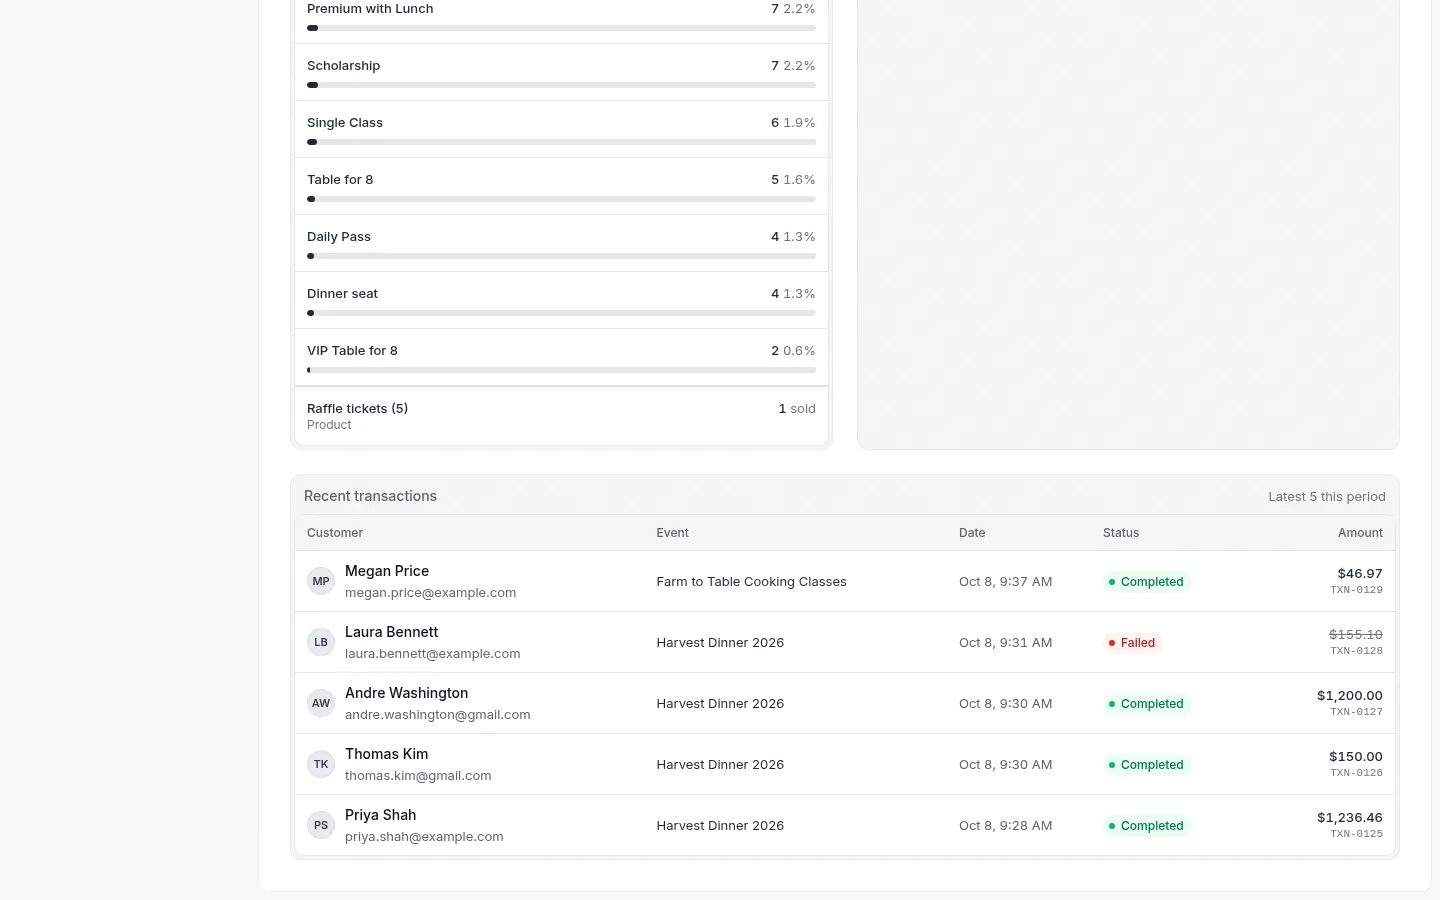
The last five payments in the period, with the customer, the event, the date, the Status and the amount.
| Status | Means |
|---|---|
| Completed | The payment went through. |
| Pending | The payment is not finished, for example a bank payment. |
| Failed | The payment did not go through. The amount is crossed out. |
| Refunded or Partially refunded | Some or all of the money went back. |
To see every payment for one event, open the event and read its registrations.
Good to know
Updated
Was this page helpful?
Thank you. Your answer helps us make these pages better.